ECG Waveform Basics and 12-Lead Application
Key Points
- ECG records cardiac electrical activity detected at the skin via electrodes.
- Standard ECG paper supports timing interpretation using small and large boxes.
- Waveform components map to conduction and contraction events across the cardiac cycle.
- Twelve-lead ECG is a core diagnostic tool in acute cardiac-symptom evaluation.
- ECG monitoring also supports medication-safety reassessment and ischemia surveillance.
- ECG findings are commonly integrated with cardiac biomarkers in acute ischemic presentations.
Pathophysiology
Cardiac electrical activation begins in the sinoatrial node, propagates through atrial tissue, pauses at the atrioventricular node, and continues through ventricular conduction pathways. The fastest pacemaker focus sets the rhythm, and ECG captures this sequence as organized waveform segments and intervals. Normal sinus rhythm reflects this ordered pathway (SA node → AV node → His bundle → bundle branches → Purkinje fibers), with AV delay supporting ventricular filling before ventricular depolarization. At the cellular level, conductive-tissue automaticity reflects repeating sodium prepotential, calcium-driven depolarization, and potassium-mediated repolarization cycles. Contractile myocytes then undergo rapid depolarization, a prolonged calcium-supported plateau, and repolarization with refractory phases that reduce risk of immediately repeated contraction. Intrinsic pacing rates decline along the pathway (SA fastest, then AV node, then His-Purkinje), so severe conduction failure can present with slower escape rhythms and perfusion compromise.
Because electrical disturbance may precede severe hemodynamic collapse, timely ECG assessment supports early diagnosis and treatment guidance in symptomatic patients.
A 12-lead ECG captures electrical activity from multiple perspectives by combining six precordial chest leads (V1-V6) with limb-lead inputs from extremity electrodes (RA, LA, RL, LL). Standard printouts commonly show about 2.5 seconds per lead in a 12-lead grid format.
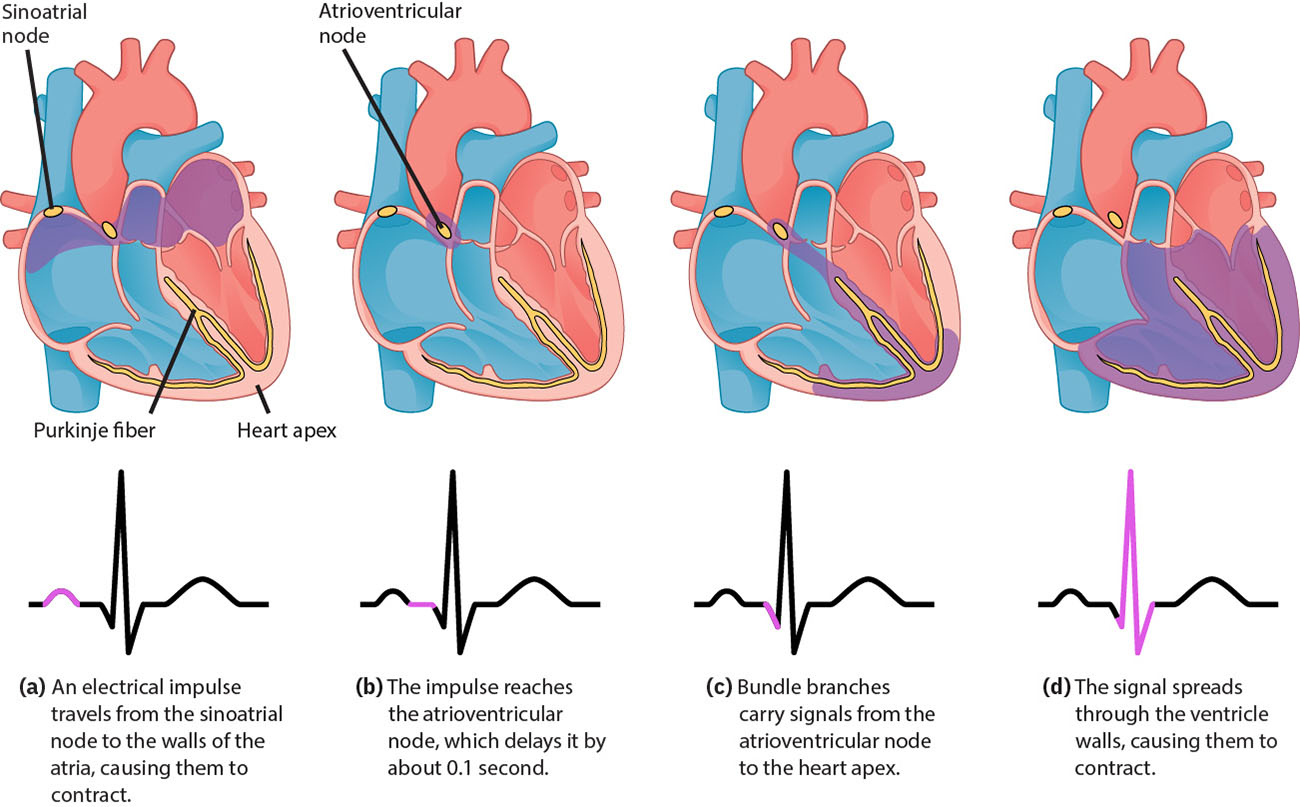 Illustration reference: OpenStax Clinical Nursing Skills Ch.18.3.
Classification
- Baseline/isoelectric reference: Zero-line context for upward or downward waveform deflection.
- Core waveform elements: P wave, PR interval/segment, QRS complex, ST segment, T wave, QT interval.
- Cardiac-cycle mapping: P wave (atrial depolarization), QRS (ventricular depolarization with onset of ventricular systole), T wave (ventricular repolarization and relaxation phase).
- Rhythm regularity intervals: P-P and R-R interval consistency for atrial/ventricular rhythm checks.
- Sinus-pathway integrity: SA-node initiation and AV-node transmission delay before His-Purkinje ventricular activation.
- Cellular-electrophysiology context: Pacemaker prepotential behavior versus contractile-cell depolarization/plateau/repolarization and refractory timing.
- Isoelectric reference: Baseline used to identify positive/negative deflection and interval start-end points.
- Monitoring formats: Six-second rhythm strips for surveillance and 12-lead ECG for broader diagnostic assessment, commonly used across ED, ICU, telemetry, and PACU workflows.
- 12-lead panel structure: Limb leads (I, II, III), augmented limb leads (aVR, aVL, aVF), and precordial leads (V1-V6).
- Lead territory mapping: Inferior (II, III, aVF), lateral (I, aVL, V5, V6), septal (V1, V2), and anterior (V3, V4).
- Clinical-use breadth: Acute symptom triage, treatment/condition monitoring, and selected screening contexts (for example cardiomyopathy evaluation).
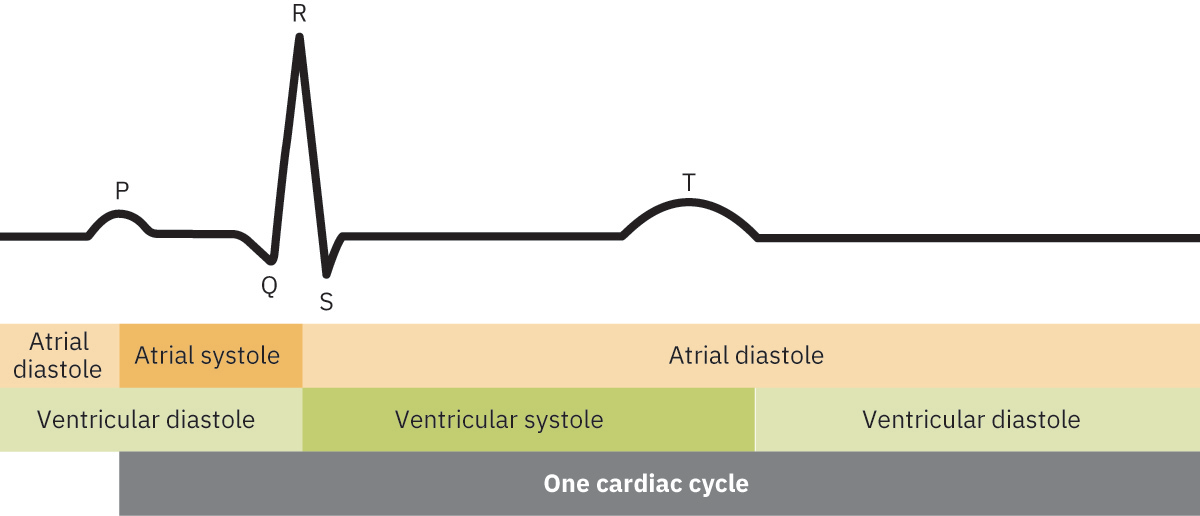 Illustration reference: OpenStax Clinical Nursing Skills Ch.24.1.
Waveform Reference Ranges
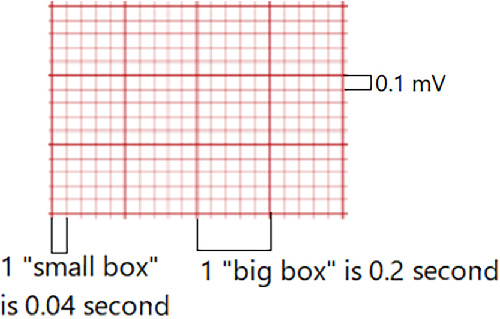 Illustration reference: OpenStax Fundamentals of Nursing Ch.19.3.
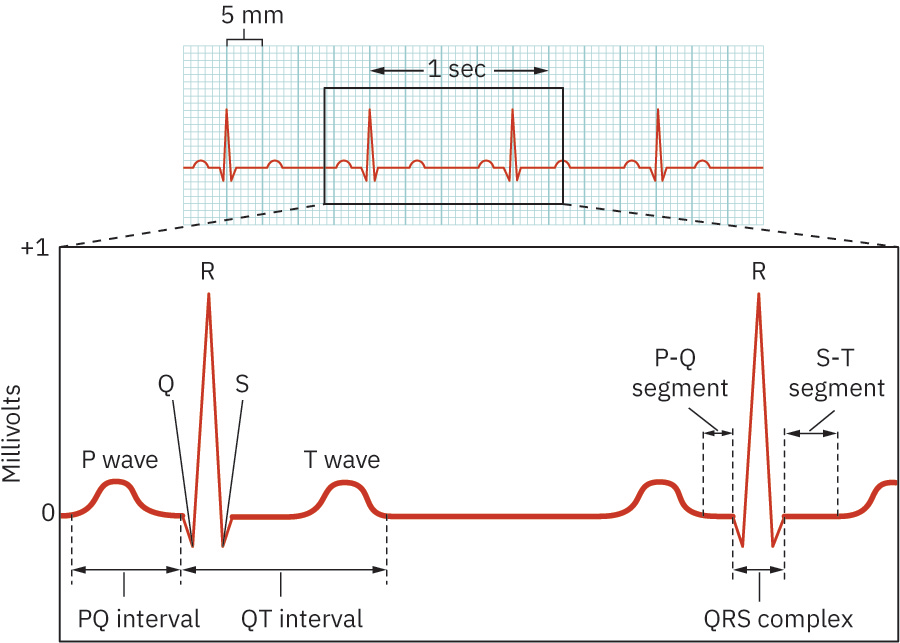 Illustration reference: OpenStax Clinical Nursing Skills Ch.18.3.
- ECG grid timing: One small horizontal box equals
0.04seconds; one large box (five small boxes) equals0.20seconds. - Vertical scale context: Vertical deflection reflects electrical voltage amplitude around the isoelectric baseline.
- P wave: Typically <0.12 seconds and <2.5 mm amplitude; usually rounded, with lead-dependent inversion/biphasic variation possible.
- PR interval: 0.12-0.20 seconds; some adult med-surg rhythm-teaching references frame normal around 0.16-0.20 seconds. Prolongation beyond 0.20 seconds suggests AV-conduction delay/block.
- QRS complex: 0.06-0.12 seconds; a pathologic Q wave pattern (for example duration >0.04 seconds, depth >1 mm, or >25% of QRS amplitude) can suggest prior infarction.
- QT interval: About 0.36-0.44 seconds, with heart-rate and sex dependence; QTc monitoring is preferred when medication-related prolongation risk exists.
- Long-QT concern threshold: QT above about 0.47 seconds in males or 0.48 seconds in females increases risk for torsades and other malignant ventricular rhythms.
- T wave: Usually upright/rounded, often less than 10 mm amplitude, and commonly between about one eighth and two thirds of R-wave size.
- ST segment: Isoelectric interval between S-wave endpoint (J point) and T-wave start; elevation/depression patterns can indicate acute injury or ischemia.
- Segment versus interval: Segment is the space between waves without a waveform; interval includes a waveform plus connecting segment.
- Cycle-timing concept: Electrical events precede mechanical contraction; ECG timing helps correlate electrical sequence with systolic and diastolic phases.
- Clinically significant ST shift: About >=1 mm ST elevation in limb leads or >=2 mm in precordial leads (in contiguous leads) supports acute-injury concern; ST depression >1 mm can suggest ischemia.
- QTc extremes: Short QTc (<0.36 seconds) can occur with selected metabolic/electrolyte states, while prolonged QTc increases risk for torsades de pointes and other malignant ventricular rhythms.
Other ECG Findings
- U wave: Small post-T deflection that may be visible in some tracings; prominence is commonly linked with hypokalemia.
- J wave: Extra deflection at the QRS-ST junction, classically associated with hypothermia.
Nursing Assessment
NCLEX Focus
Questions often test recognition of expected waveform structure and when 12-lead acquisition is the priority action.
- Assess cardiac symptoms and urgency that warrant immediate ECG acquisition.
- Assess tracing quality, lead placement context, and artifact risk.
- Assess basic cycle components and timing consistency on ECG paper.
- Use calipers when available for precision interval checks; box-based strip counting remains the most common bedside method.
- Assess P-P and R-R interval patterns for regularity and atrial-ventricular dissociation clues.
- Correlate unstable bradycardia with possible conduction-system failure and prioritize oxygenation, hemodynamic support, telemetry, and urgent escalation.
- In pediatric and congenital contexts, correlate persistent severe bradycardia or AV dissociation with possible congenital complete heart block and likely pacing-pathway evaluation.
- Assess whether rhythm-strip findings require expanded 12-lead evaluation.
- Remember ECG alone does not confirm pumping effectiveness; integrate pulse/perfusion findings and treat pulseless electrical activity as a no-output emergency state.
Nursing Interventions
- Obtain and prioritize 12-lead ECG in patients with acute cardiac-symptom concern.
- Support continuous monitoring in high-acuity settings and document rhythm-strip findings per policy.
- Recognize telemetry as continuous rhythm monitoring that supports rapid detection of evolving dysrhythmia patterns.
- Communicate new or concerning conduction-pattern changes promptly.
- Integrate ECG findings with biomarkers and overall perfusion status.
- Coordinate escalation pathways when findings suggest evolving cardiac instability.
Delay-to-Diagnosis Risk
Failure to obtain timely ECG evaluation in acute symptoms can delay definitive treatment of life-threatening cardiac events.
Pharmacology
ECG trends are interpreted alongside cardiac biomarkers and treatment response to guide medication timing, escalation, and reassessment in acute cardiac care.
Clinical Judgment Application
Clinical Scenario
A patient presents with acute chest discomfort and diaphoresis, and bedside monitoring raises concern for conduction abnormality.
- Recognize Cues: Symptom pattern and monitor change suggest possible acute cardiac event.
- Analyze Cues: Rhythm-strip concern requires broader electrical evaluation.
- Prioritize Hypotheses: Ischemic or dysrhythmic process may be evolving.
- Generate Solutions: Acquire 12-lead ECG, compare findings, and prepare for rapid intervention.
- Take Action: Perform and communicate ECG urgently to the treatment team.
- Evaluate Outcomes: Timely diagnosis supports earlier targeted management.
Related Concepts
- systematic-ecg-interpretation-and-dysrhythmia-triage - Biomarker trends are often interpreted with ECG findings in acute care.
- arterial-vs-venous-blood-gas-use-in-care - Combined physiologic data can refine urgent cardiopulmonary assessment.
- respiratory-failure - ECG monitoring helps detect cardiac strain during severe respiratory compromise.
- patient-care-coordination-interdisciplinary-referrals-and-case-management - Rapid interdisciplinary communication improves emergency throughput.
- evidence-based-decision-making-in-nursing - ECG-driven action exemplifies data-informed nursing judgment.
Self-Check
- How do ECG paper boxes support interval and rhythm interpretation?
- When should a six-second rhythm concern prompt immediate 12-lead ECG acquisition?
- Why are ECG findings commonly interpreted with cardiac biomarkers in acute presentations?